Neil Mukerji
The Stock Usage Comparison Report
This month we’ve completely overhauled our Stock Usage Comparison Report, transforming it into a powerful tool to help you run an efficient business.

The Stock Usage Overview
It all starts with an overview of your stock’s performance. See your net revenue by ingredient category, your sales / waste / give-away split, and the difference between your overall actual and theory gross profit percentages.
Variances and The Control Gap
In addition to the long standing usage variance percentage – which is the difference between your actual and theory usage as a proportion of your actual usage – we’ve also introduce the Control Gap. The Control Gap is the variance between the actual total cost of ingredients used and the theory cost of ingredients that were attributed to item sales, expressed as a percentage of the net revenue in the period.
In a perfect world not only would your theory usage exactly match your actual usage, but there would also be no wastage, comps or director concessions. This would yield a control gap of 0%. While any stock usage variances will increase the Control Gap, it’ll also be increased by wastage and items being given away rather than sold. A high Control Gap is an immediate indication that something is wrong. If there’s also classic stock variance then it’s time to investigate recipes or physical security, but otherwise there are probably efficiency gains to be had by reducing wastage or encouraging comps to be moved to ingredients with a higher margin.
Lead Type Summary

Running a kitchen and running a bar are two very different challenges, so it makes sense to allocate ingredients primarily to one or the other so Kobas can report their stock usages separately.
Ingredient Category Summary

This next resolution setting allows you to inspect and compare ingredient performance by category. Is your Control Gap better in beers or spirits? Are your chefs cooking up too much rice which you’re losing to wastage? The category summary figures give you a better idea of ingredient performance by type.
Per Ingredient Figures

Finally this report allows you to inspect usage, variance and Control Gap figures on a per ingredient basis, perfect for precision analysis of revenue generation and loss.
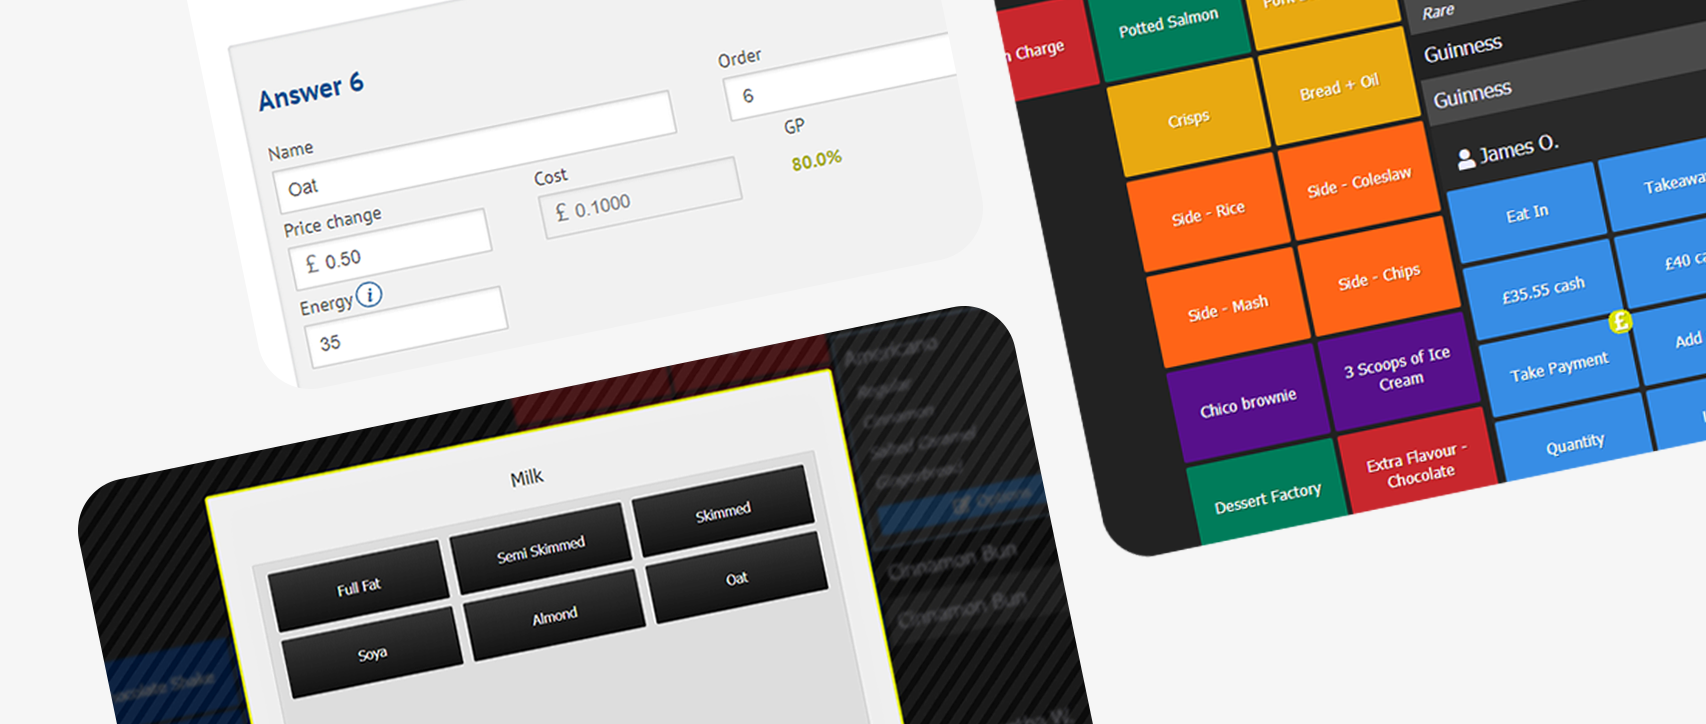
All tables in this report can be instantly ordered by clicking on any column header. Detailed explanations of every figure are available by hovering over or tapping the “i” information icon.
It’s well worth spending time analysing the Stock Usage Comparison report – it’s a fine example of how Kobas puts you in a position to understand and optimise your business like never before.