Understanding operational performance across your sales, stock and cash, is a fundamental part of running any hospitality business. Whether you operate a restaurant, bar, pub or club, it’s crucial to know where you’re making money and losing money, your profit margins, wastage levels, cash discrepancies and more.
Kobas puts you in control by providing a suite of reports across our Insights product pillar, including operational performance reporting. In return, empowering management and head office with accurate data that can be leveraged to drive profitable business decisions.
Our Insights product pillar also contains reports on customer engagement and labour analysis.
Operational Performance Reporting

Understand sales performance
Uncover key sales performance data across your hospitality business with a range of customisable reports, enabling you to turn insights into actions.


Access sales insights
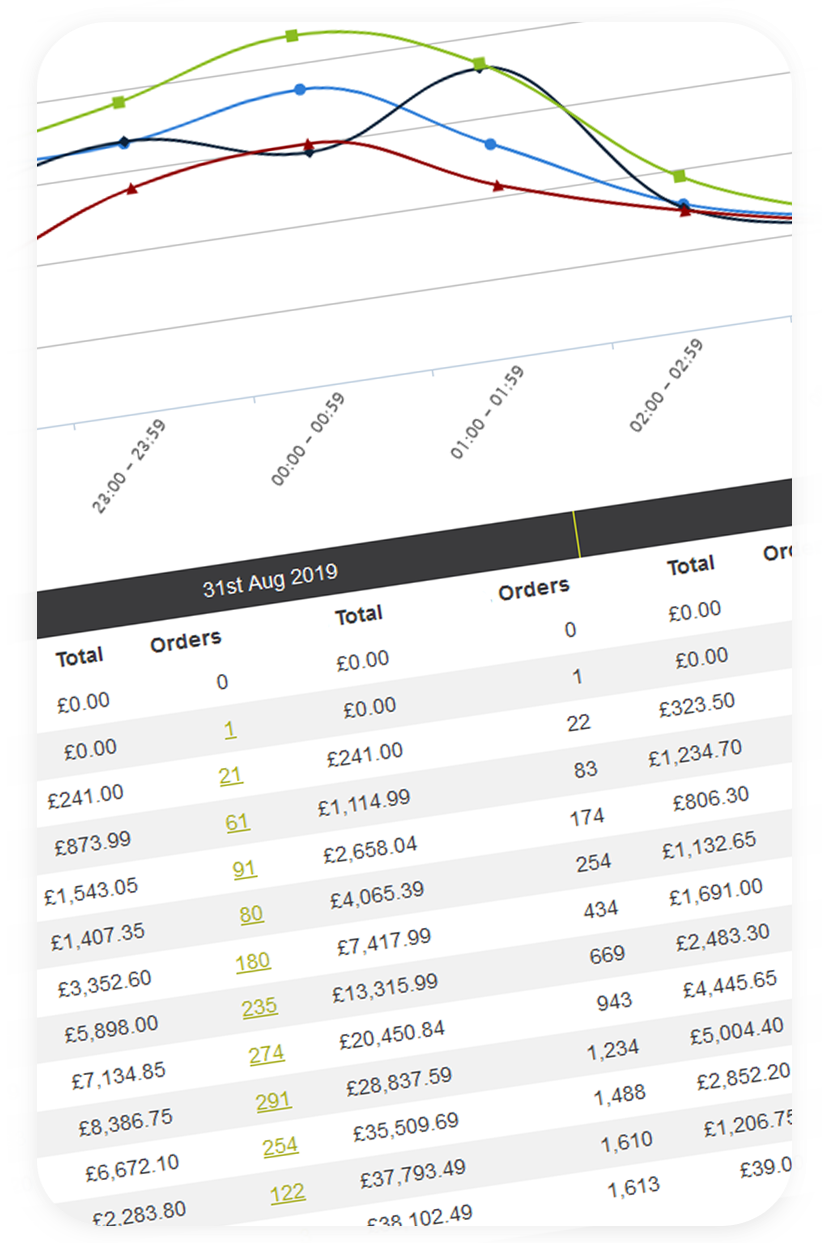
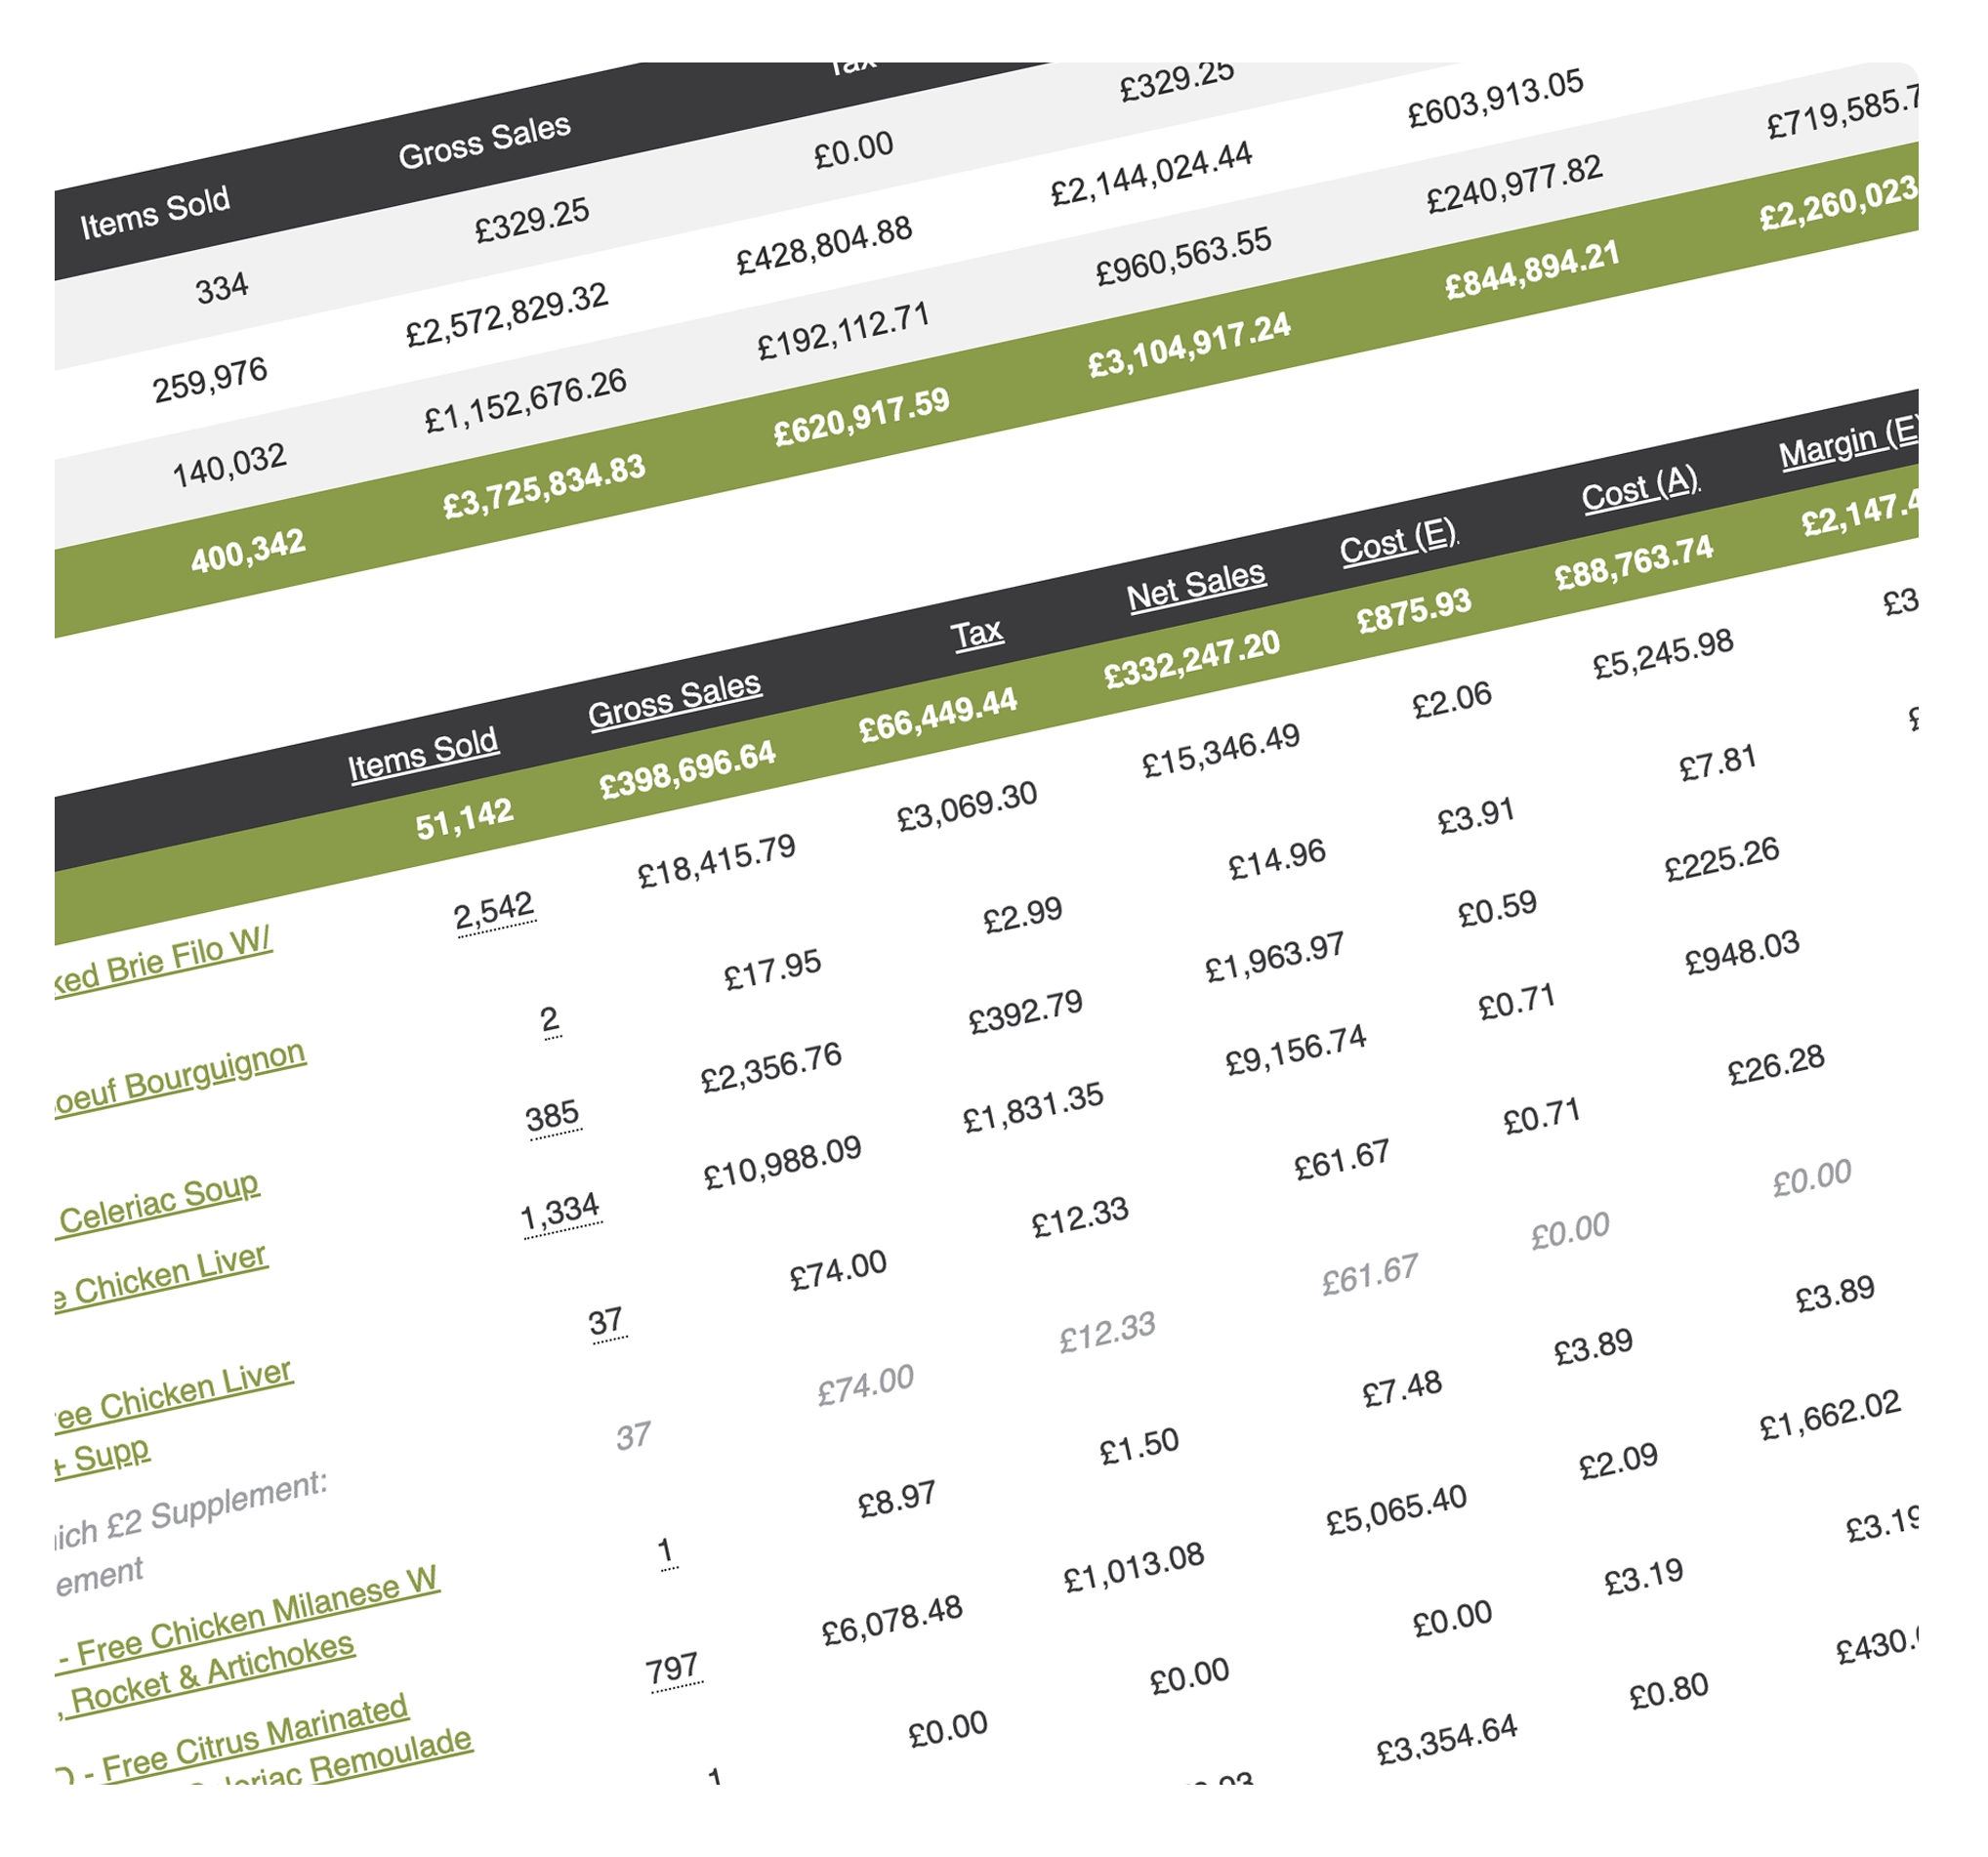
Kobas provides a 360 into all sales activity across your business. Analyse sales trends such as top-performing dishes by quantity sold and/or by highest profitability level, understand historical sales from the previous year to assist with the creation of budgets, forecast targets, and schedule successful and profitable menu plans.
Track revenue stream success
When using our delivery and click & collect platform, teams can identify which revenue stream generates the most sales, what the most popular items are across those channels, and when the most sales are processed.
Monitor stock success
By connecting our technology across the Kobas product pillars, our system knows exactly what you’ve ordered, what has been used and what has been wasted.
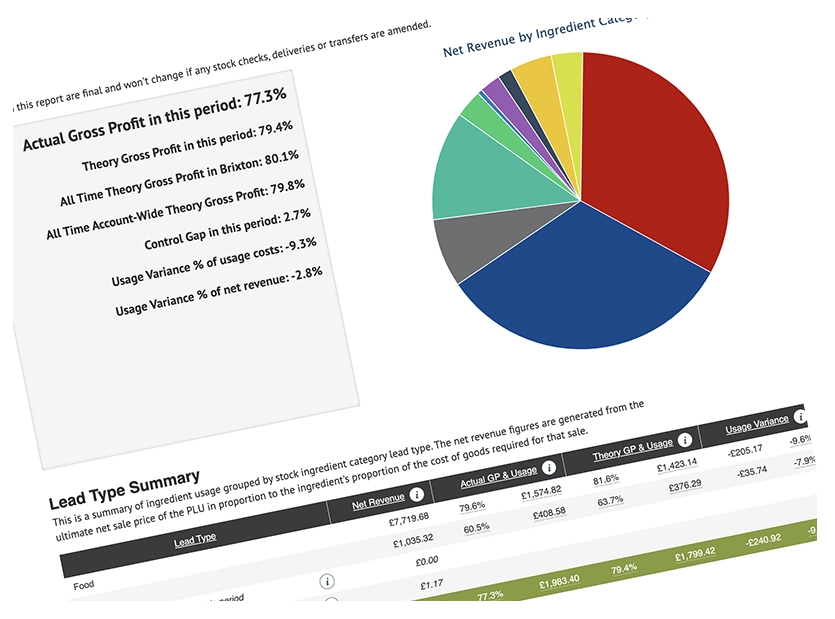
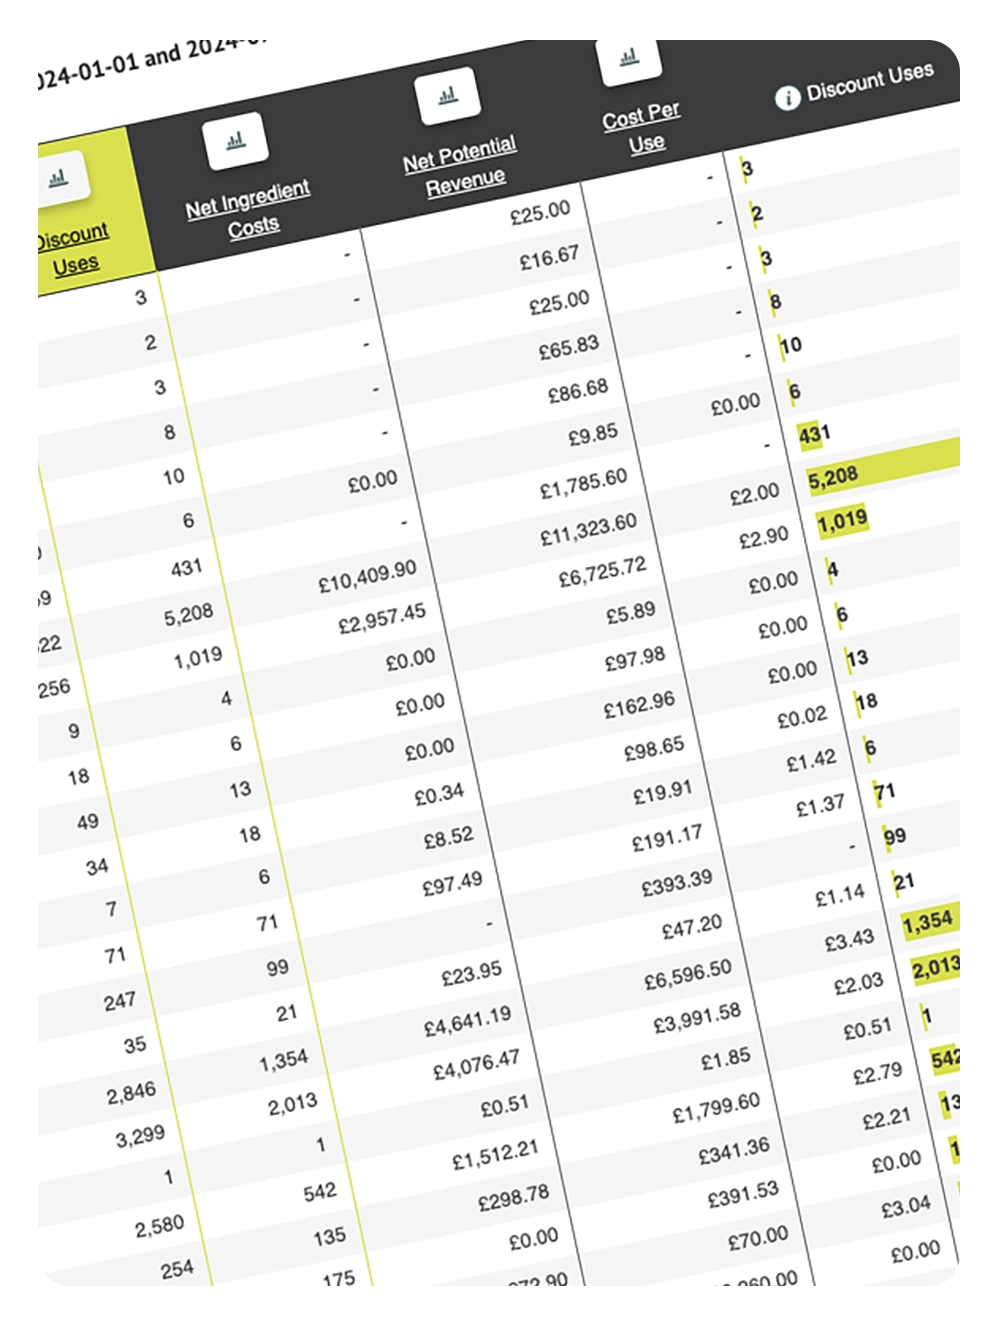
Our operational reports enable management and head office to understand stock related activity in detail, tracking ingredient usage including central kitchen and batch productions, compare theoretical usage with reality and much more.

• Analyse your stock usage in comparison to the theoretical usage, revealing discrepancies that may require additional attention and action.
• Understand supplier costs in further detail with annual reports, helping you to analyse total spends and compare supplier costs.
• Enhance menu profitability by analysing the ingredients used, recipe portions and supplier costs. Could you increase the sales price or change the recipe slightly to increase the profit margin?
• Monitor your wastage levels and the costs incurred.
Cash analysis
Having live data available on your cash flow and profitability is crucial. With our cash analysis reports, management and head office can keep track of all cash related activity across the business.
• Our detailed operational overview report extracts all key information from your Kobas system to generate a full profitability report, taking into account all costs including your stock and staff.
• Monitor petty cash, AWP top-ups, tips and cashback.
• View safe and till float reports, petty cash reporting and banking analysis.
• Track cash from the till, through the safe, right into your bank account.
Visual analysis
View your reports in a visual format, displaying a variety of clear graphs and charts to ensure trends and discrepancies can be identified quickly and accurately.
We’ll let you know about areas that may require further observation too. How? Kobas uses colour signals on crucial parts of your data to draw attention to certain areas. For example, if your sales are under target this month, our system will automatically highlight it red.